Ready for a smarter way to scrape web data?
Complete the registration now and enjoy 22GB FREE
Complete the registration now and enjoy 22GB FREE
Nimble Analytics and Management
Yes! Current Vs Past reports and Custom Reports can both be exported to CSV.
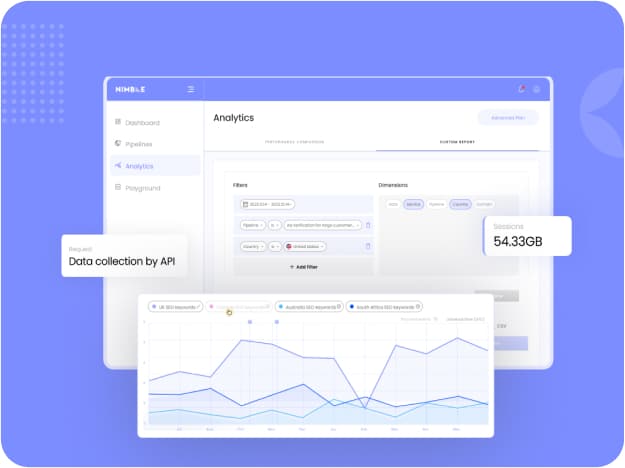
Yes! The Nimble Analytics Hub includes a custom report with multiple filters and dimensions. To view the report, visit the Nimble User Dashboard and go to Analytics → Custom Report.
We’re constantly updating and adding new features to the Analytics Hub, but presently we support:
- Current Vs Past (including MoM and YoY)
- Performance Comparison (up to four trend lines)
- Custom Reports (Multiple filters and dimensions)
For more information on our reports, see our Dashboard documentation at:
https://docs.nimbleway.com/management-tools/nimble-dashboard
Budget Caps help limit spending from exceeding your expectations. Budget Caps are set on the pipeline level by going to Pipelines → (your desired pipeline) → Settings → Advanced Settings → Budget spend limit.
Yes. Every pricing plan includes a maximum number of pipelines that can be enlarged by upgrading to a bigger plan. For more details, see our pricing page: https://nimbleway.com/pricing/
Pipelines can be created and managed in the Nimble User Dashboard, available at: https://app.nimbleway.com/login
Nimble Pipelines help our users organize their usage on our platform. Every request sent to Nimble flows through a specific pipeline, and multiple pipelines can be created to help distinguish between business-specific use cases. Pipelines also contain settings that are inherited by their requests automatically to help with organization and reducing errors.
Yes! Nimble Pipelines are our solution to disorganized data collection. Each pipeline contains it’s own settings, and all of our reports can be filtered by pipeline. Give each Pipeline a custom name, and every request sent to Nimble goes through a specified pipeline, helping you keep track of request types, volumes, and more in a way that makes sense for your business logic.

Sign up for a 7-day trial.
