Smarter Web Scraping with Nimble Analytics & Management
Gain full control over your web scraping operations
Nimble empowers you with powerful tools to track, analyze, and optimize your data operations.


Managing web scraping with can be challenging
Businesses face many challenges when collecting web data.
Web scraping projects are often complex with many moving parts distributed over many systems, making usage and spending hard to track. Dealing with unintentional spikes or bugs can also take up huge amounts of resources.


Smarter Management for Web Data Collection
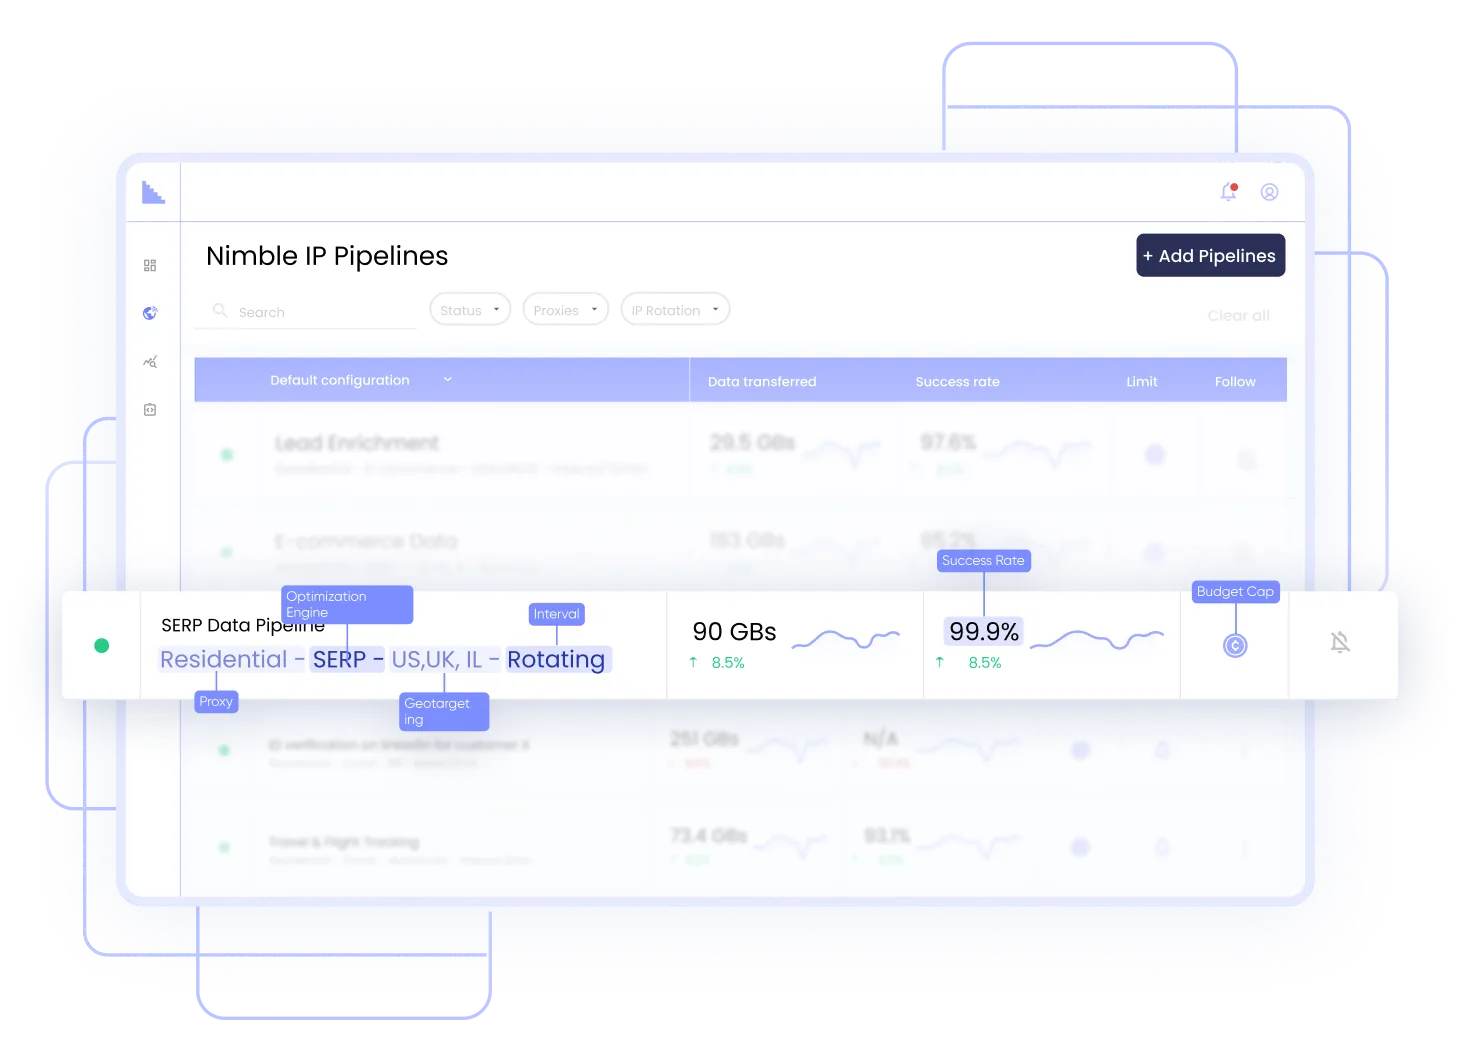
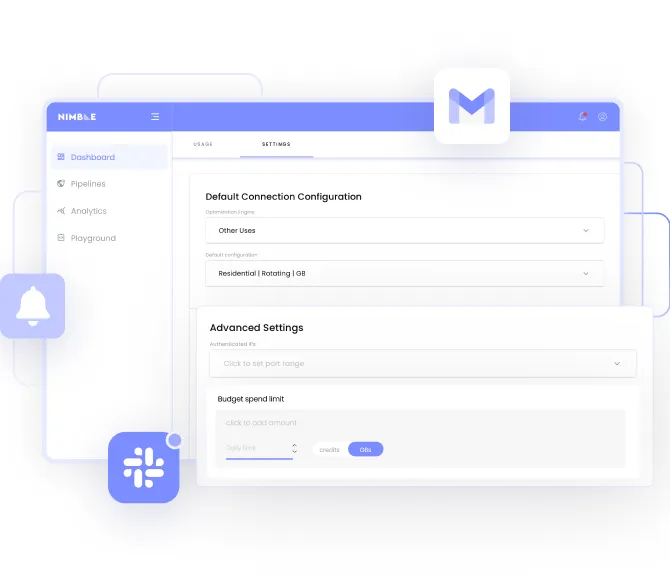
No more zones, no more sub-users. Every request to Nimble IP flows through a pipeline, empowering you to:
Use pipelines to organize data management by business use. Categorize pipelines by client, data source, use case, or any other criteria that makes sense for your business.
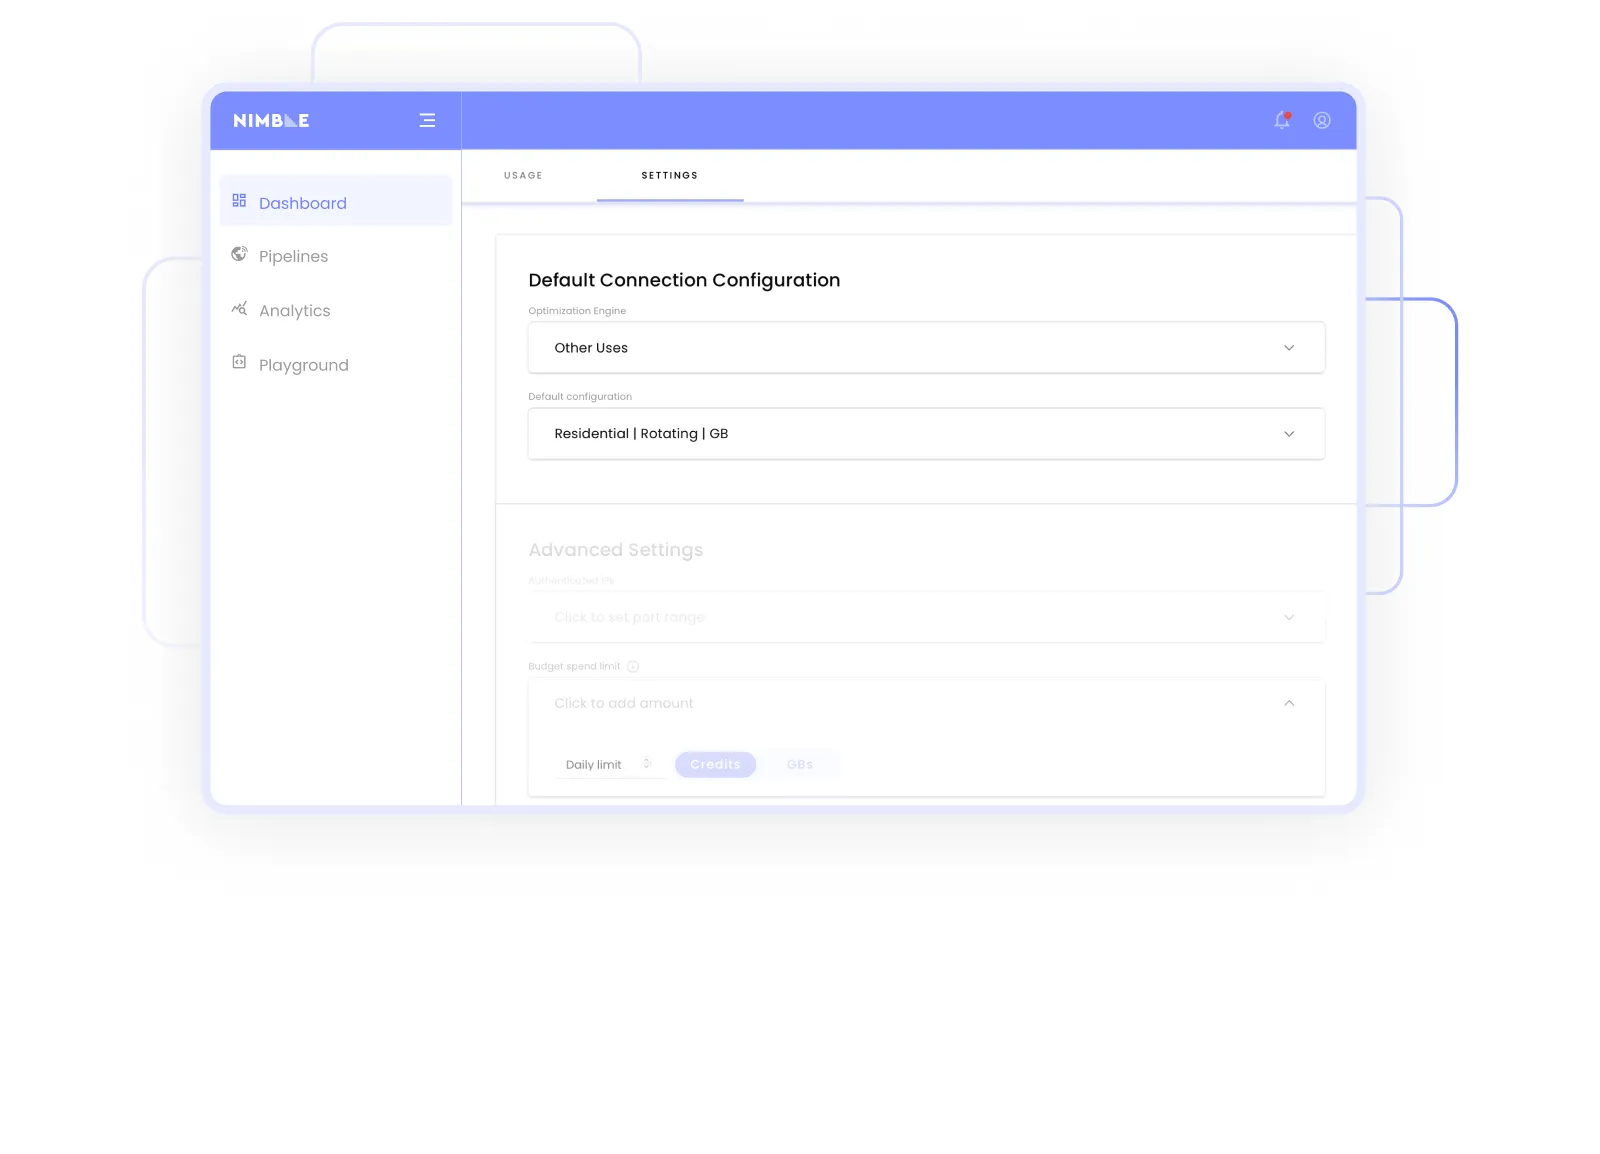
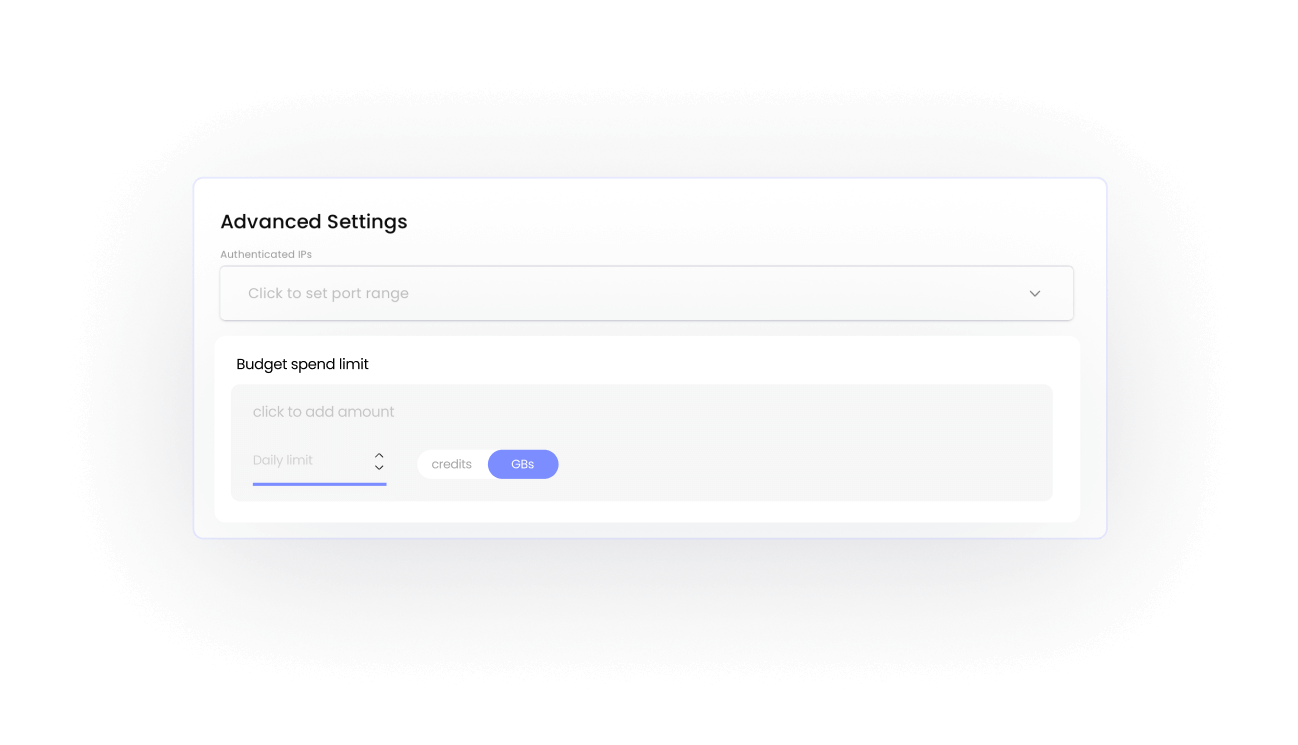
Each pipeline has its own budget cap, so you can set higher budget caps (or no cap) on critical applications while setting more restrictive caps on others.
Set default configurations on each pipeline to ensure consistent behavior across all child requests from a centralized source.
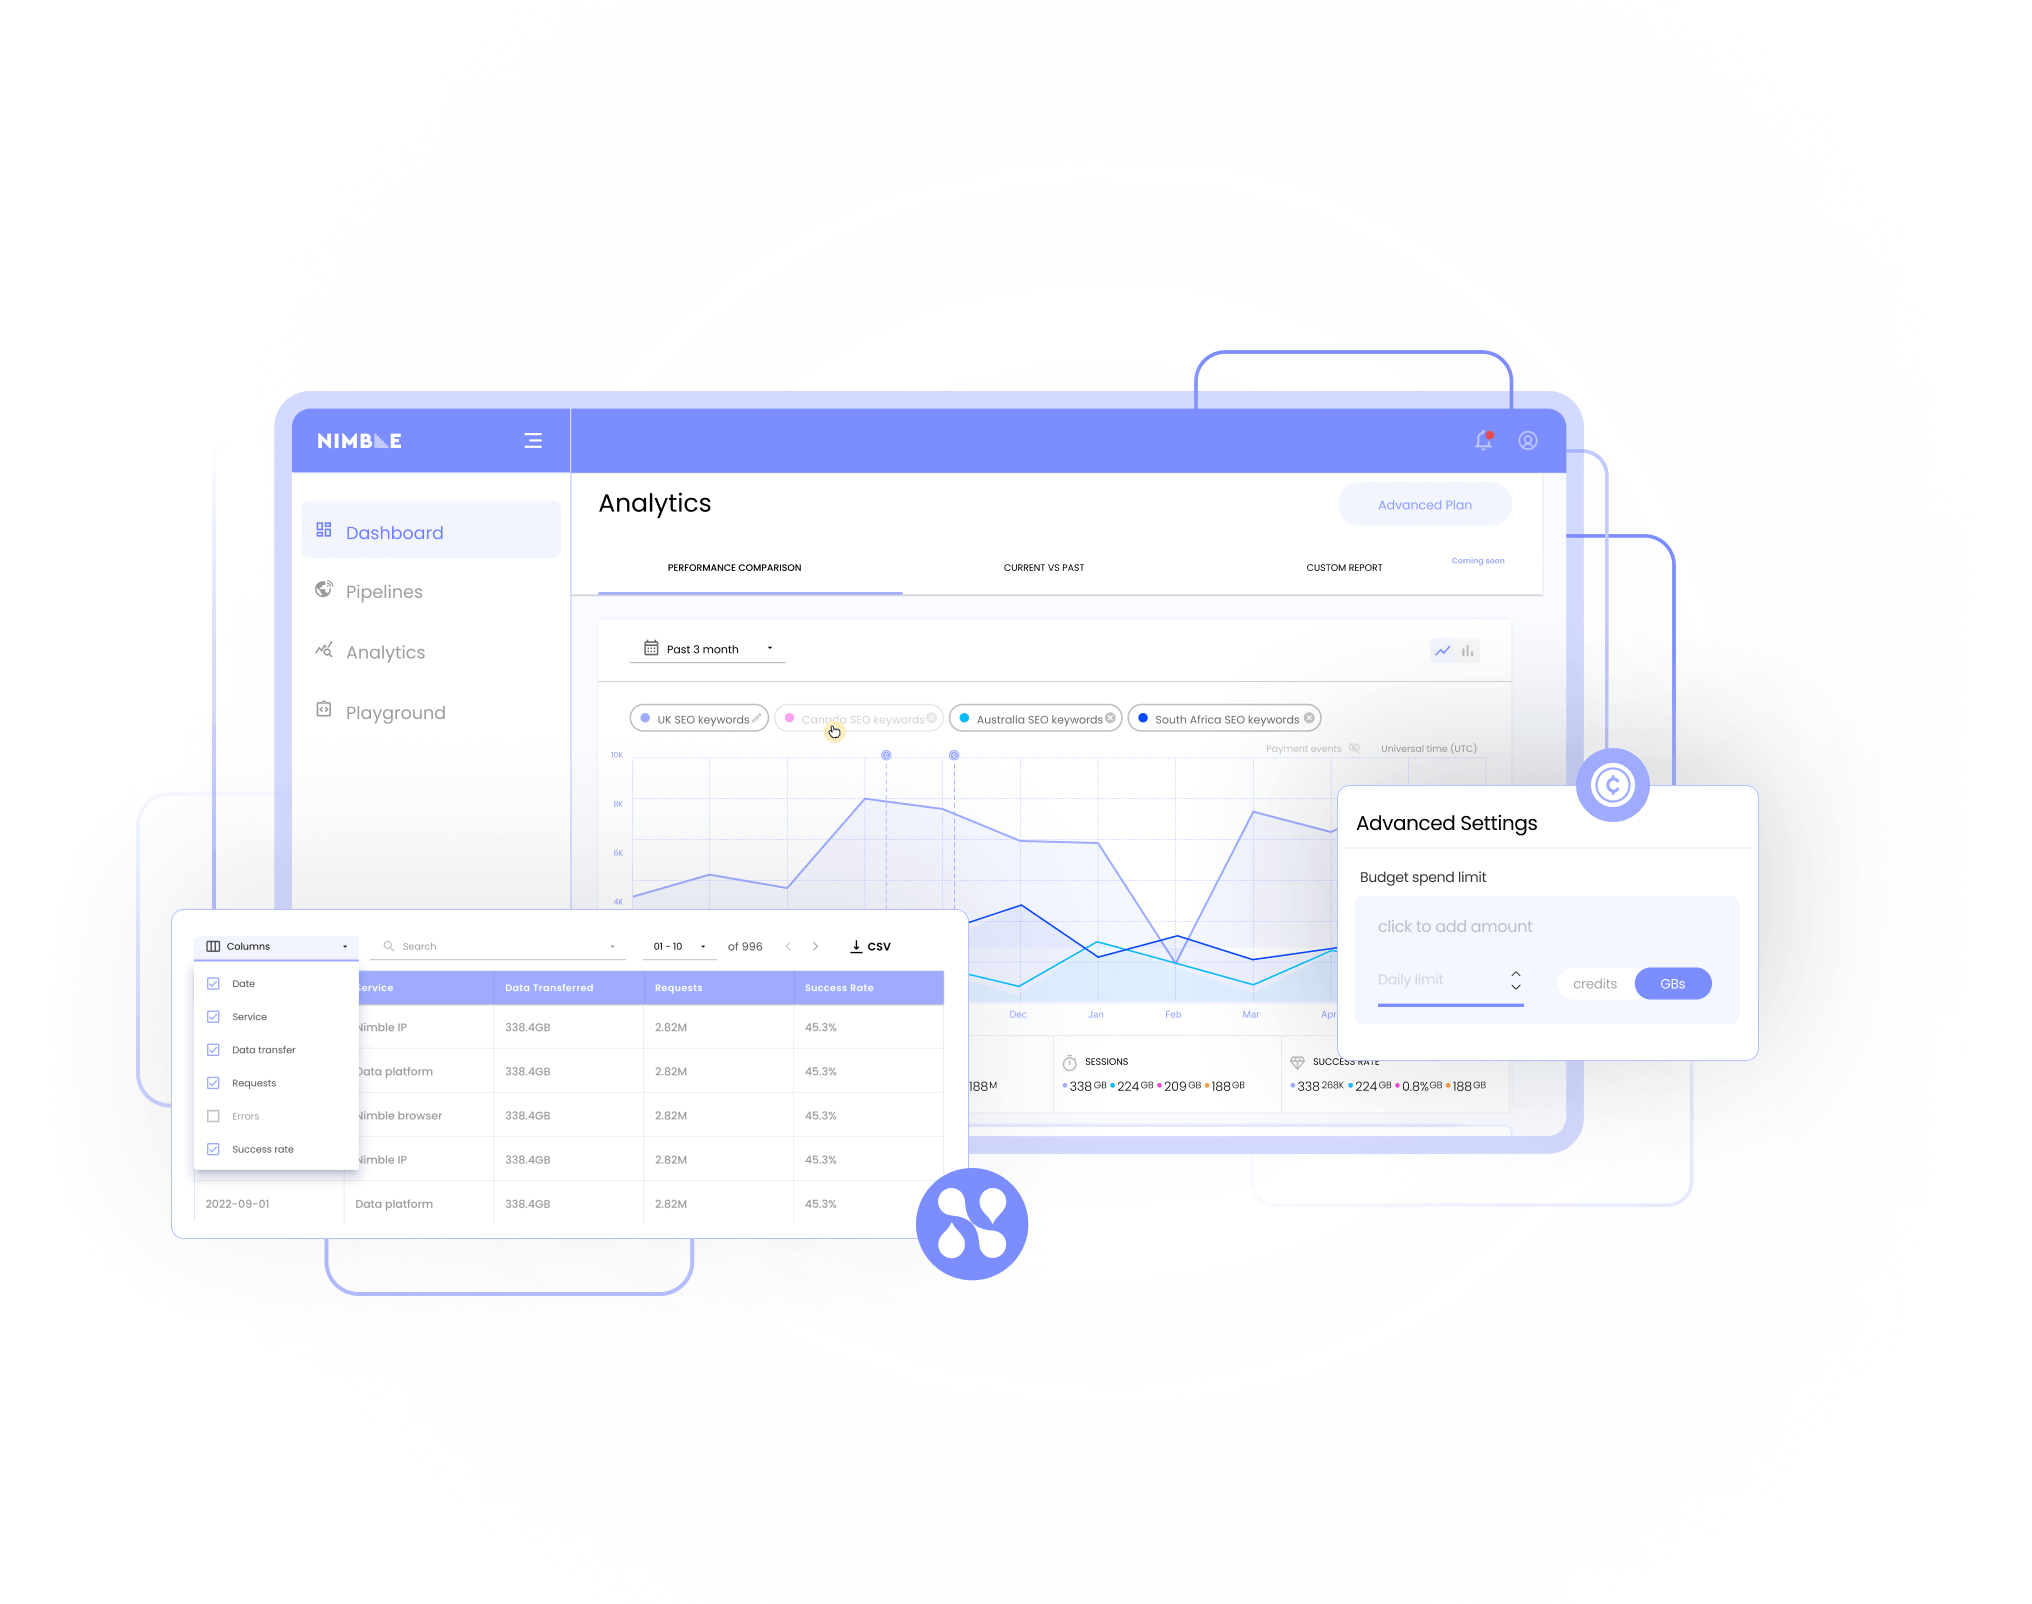
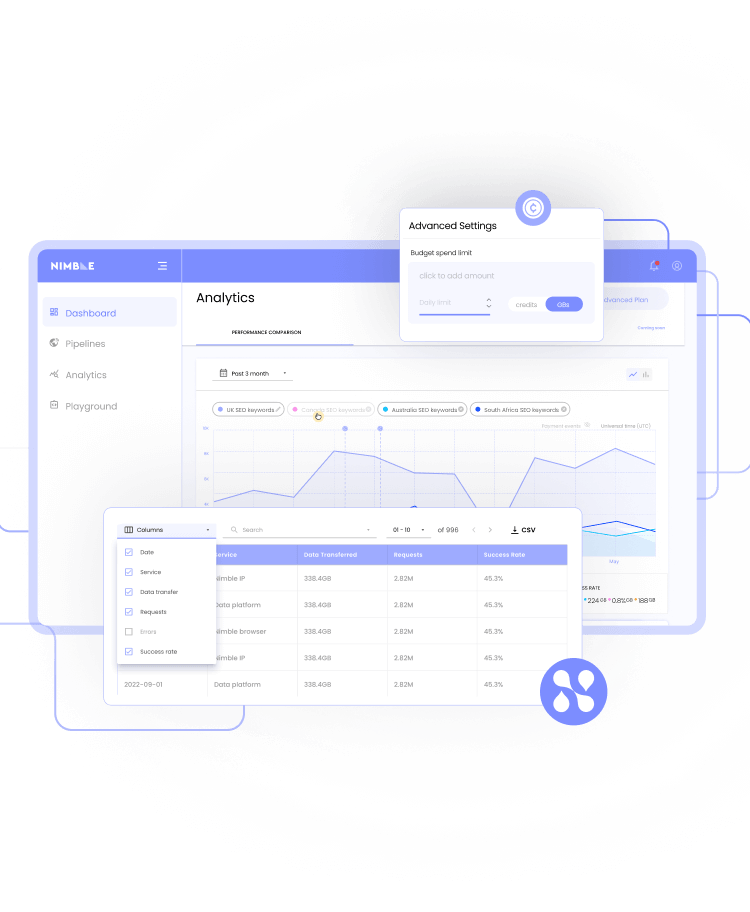
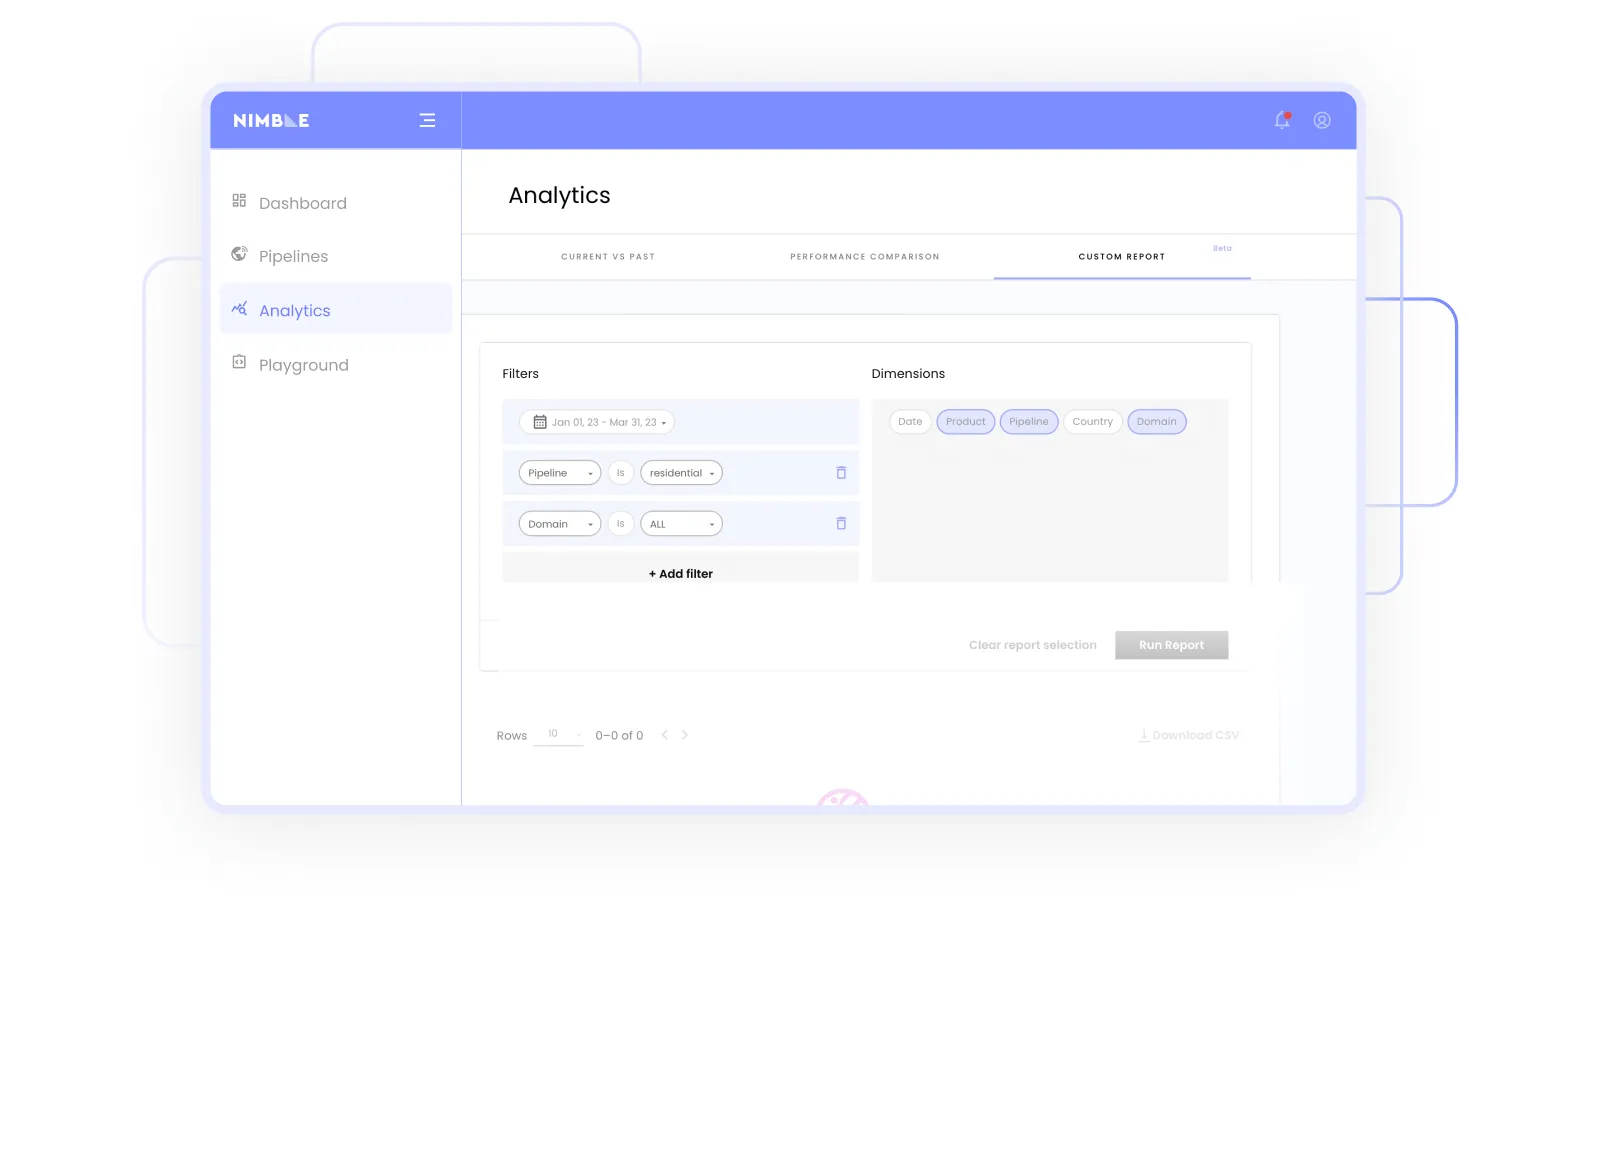
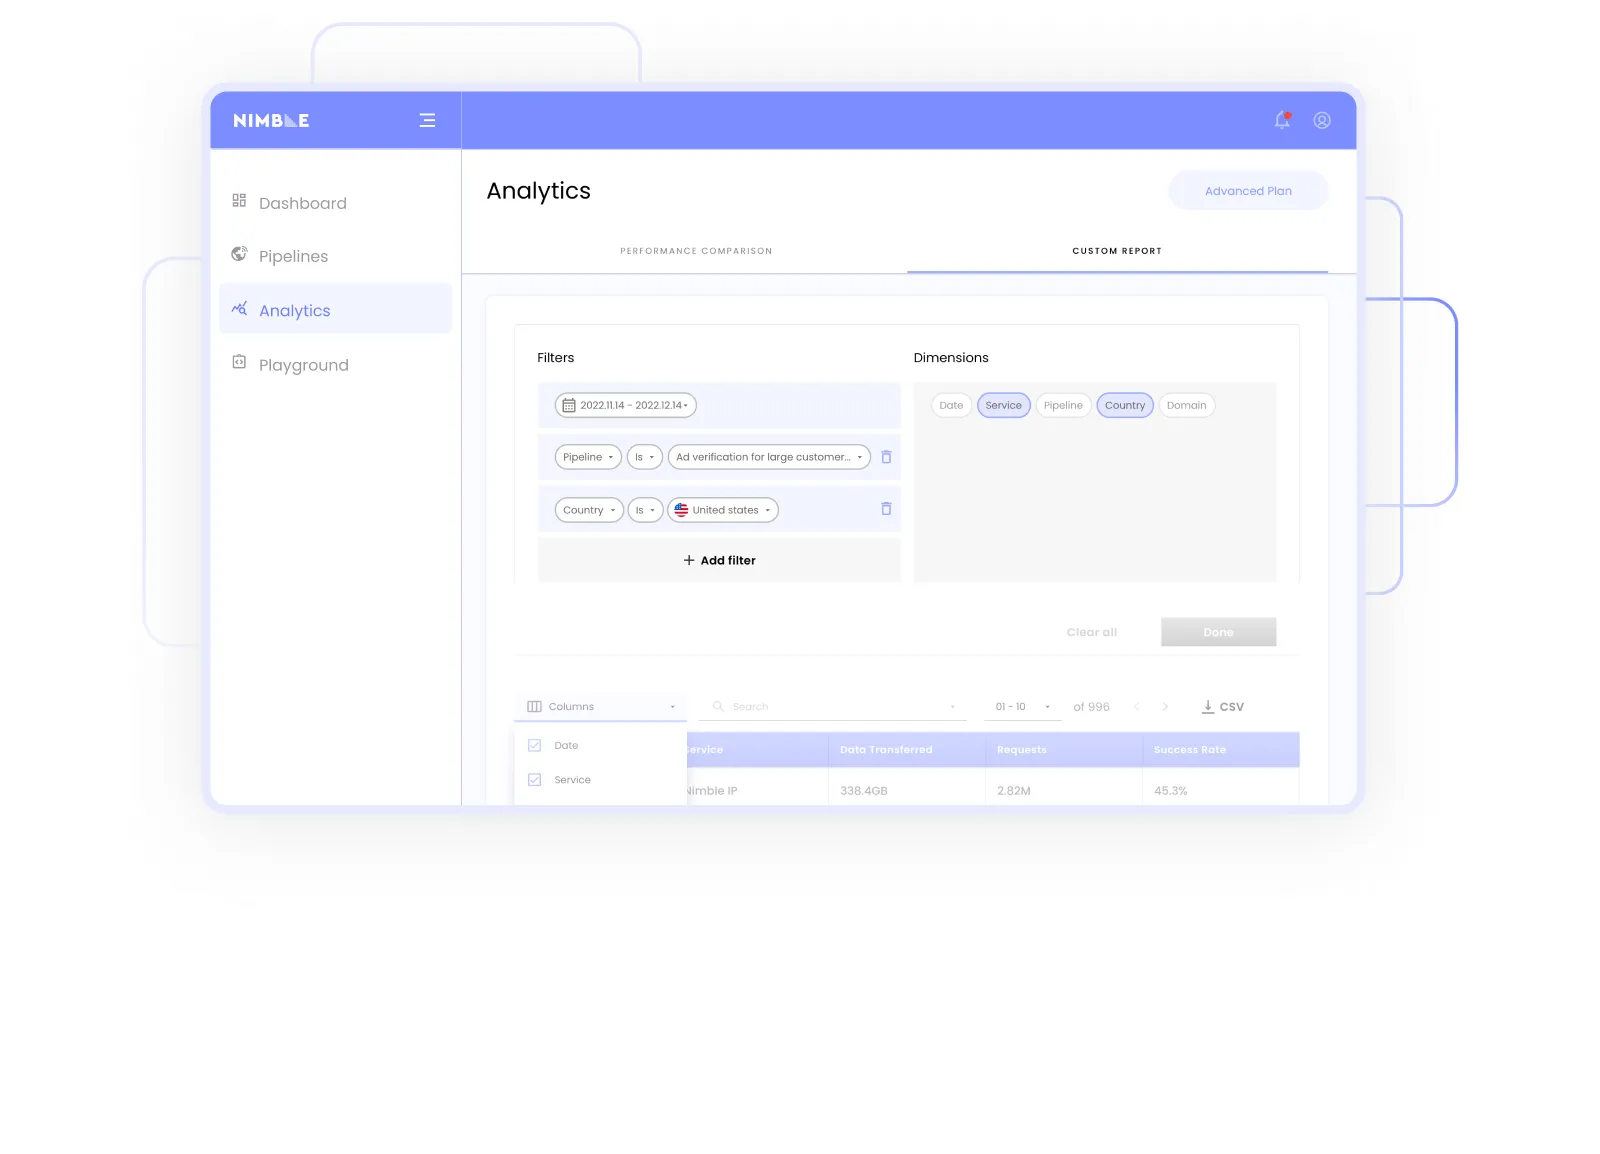
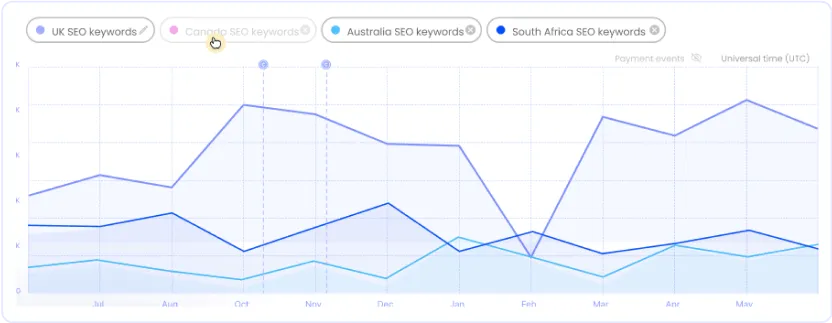
Nimble Analytics Hub: Real-Time Insights for Web Scraping Success
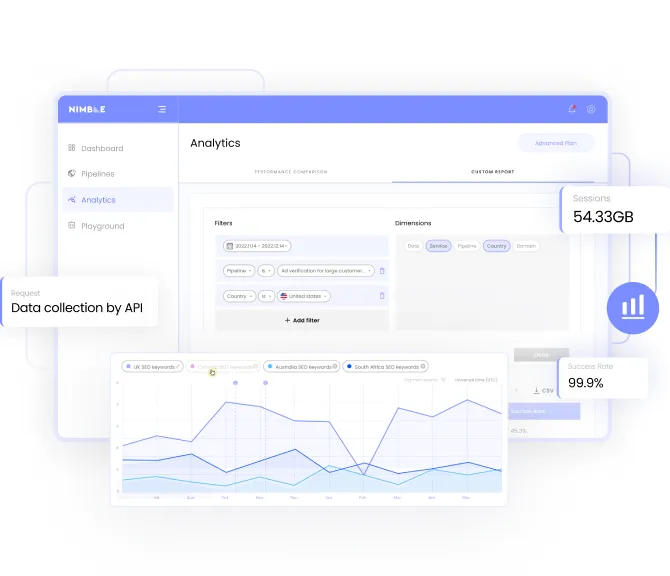
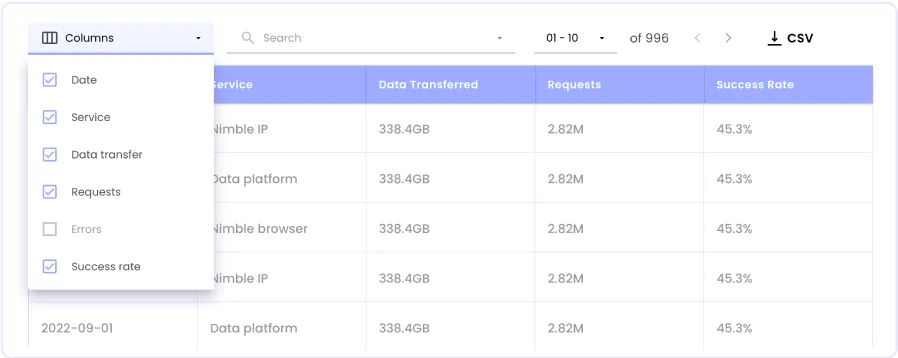
Optimize web scraping performance with Real-time data analytics
Sleep better with Granular budget controls


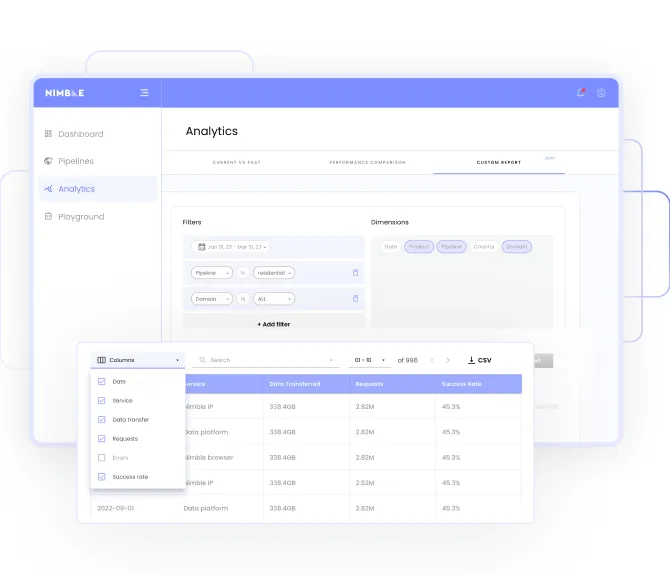
Access Seamless Web Data Management via Dashboard & API
Nimble offers versatile access to management tools and reports through both our User Dashboard and Admin API, enabling you to access a range of data, reports, pipeline management, and more.
Analytics & Management FAQs
Answers to common questions regarding Nimble's management tools